Last weekend was an exciting one. I went for my first ever hackathon (don’t get me started on the name) and it was AWESOME. With all my conviction, I can say that the experience was really refreshing 🙂 Lets revisit the weekend together shall we?
Registration
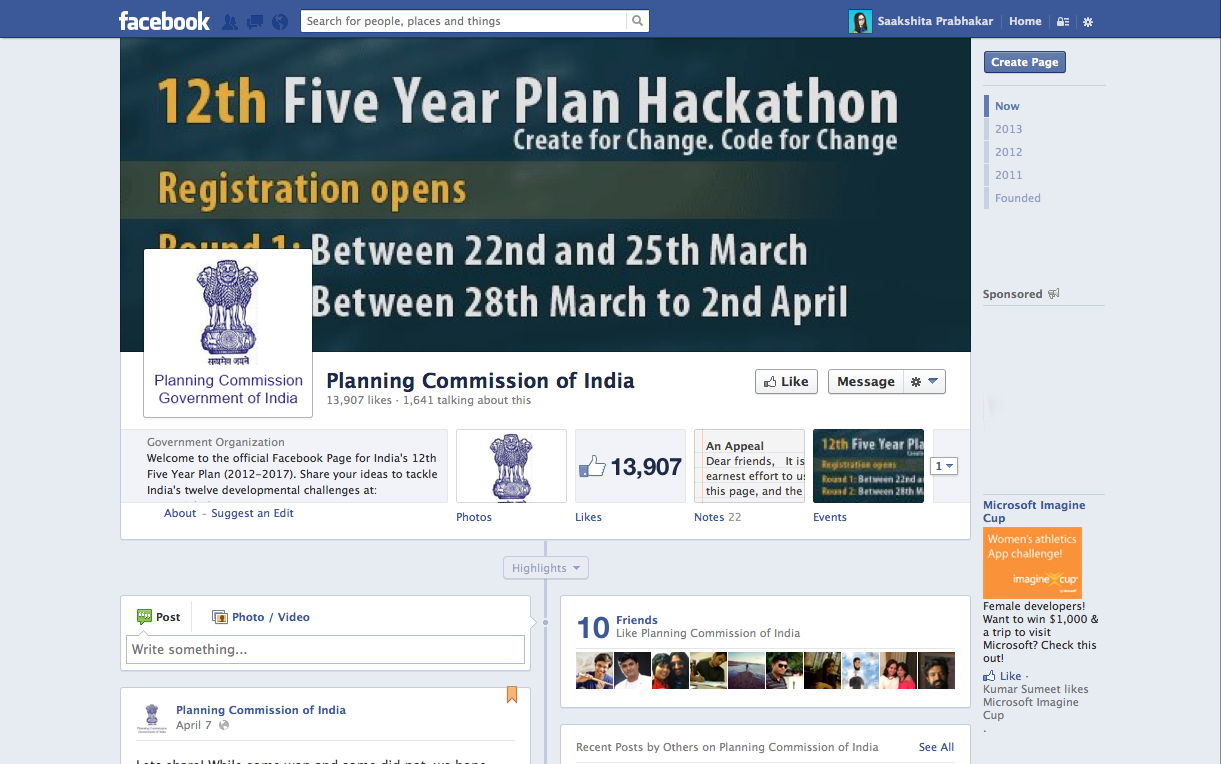
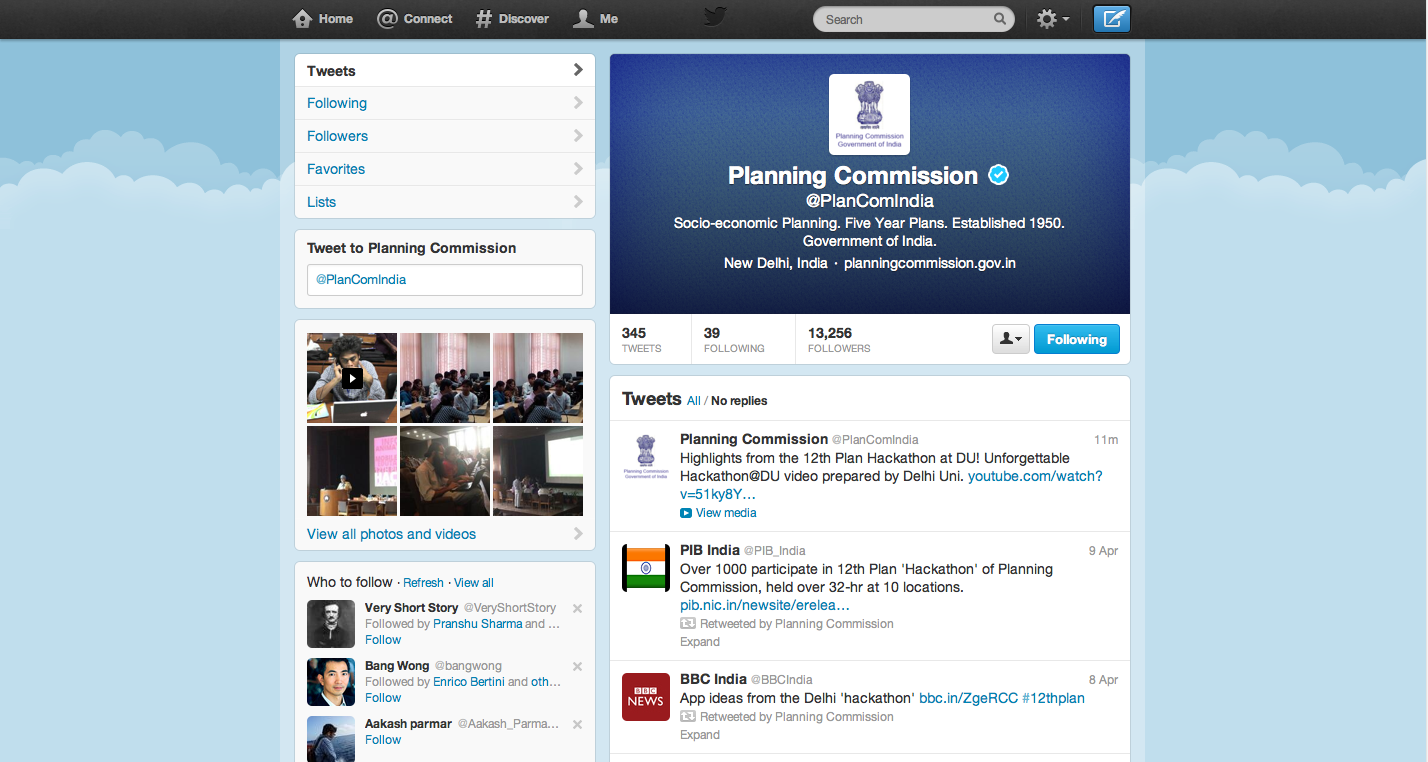
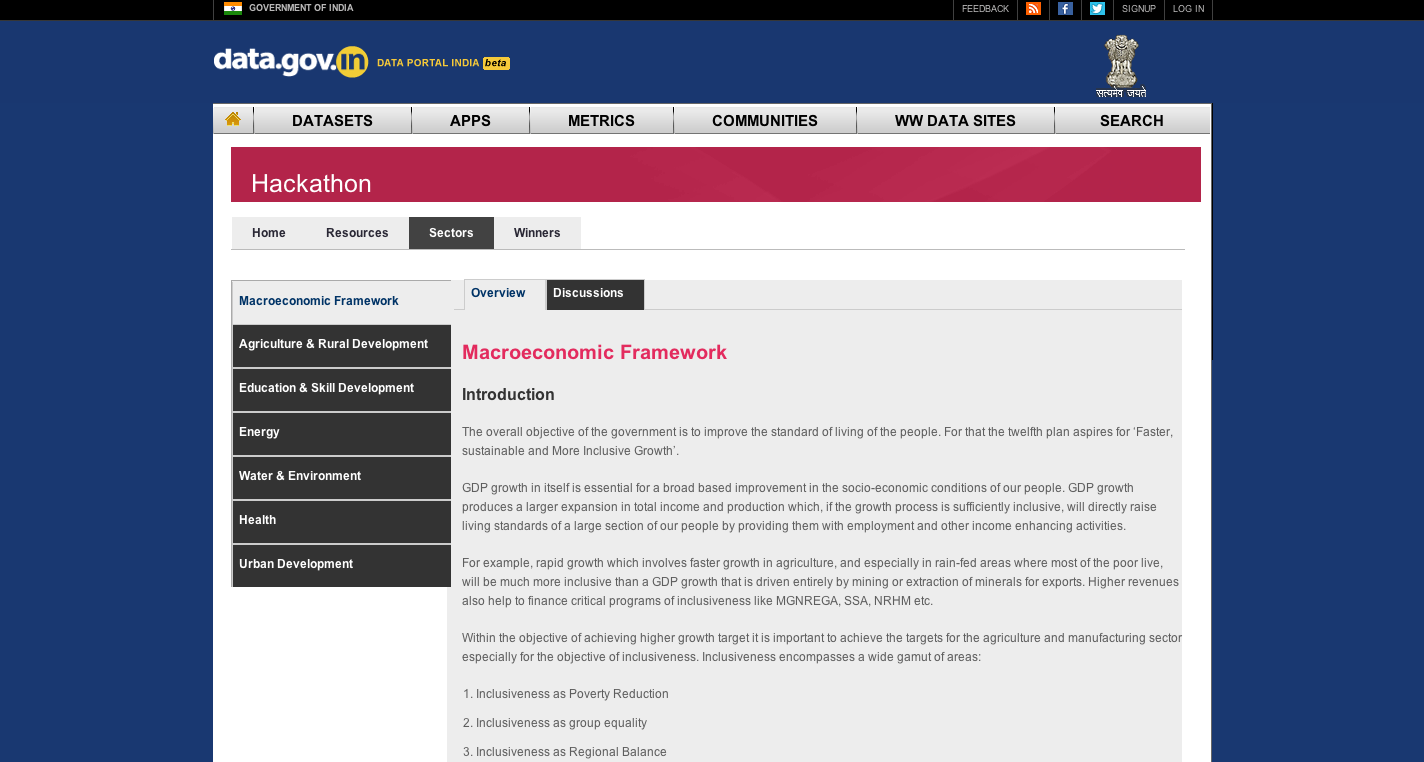
After my last post, I kind of lost interest in the idea of registering for the hackathon until 3rd April when my social media accounts were swarmed with hackathon excitement. Stumbled on the hackathon page to realize that the entries were closing on 4th midnight. Without giving too much credit to my confused, lazy mood, I registered and started reading the instructions. By this time I was totally into it. All the buzz in newspaper, news channels, social media started surfacing. At this point I must admit that (for a govt initiative) I was pleasantly surprised with the website, the instructions, schedule, FAQ’s and other organization skills they showed on their website. The planning commission had twitter account and facebook pages which were surprisingly working and answering your queries all through the night (generally you only see people writing to these initiatives with no response) KUDOS to that! When you are used to associating words like chaos, lost, confused, non user-friendly with government websites and competitions, this one would make anyone smile.
Categories
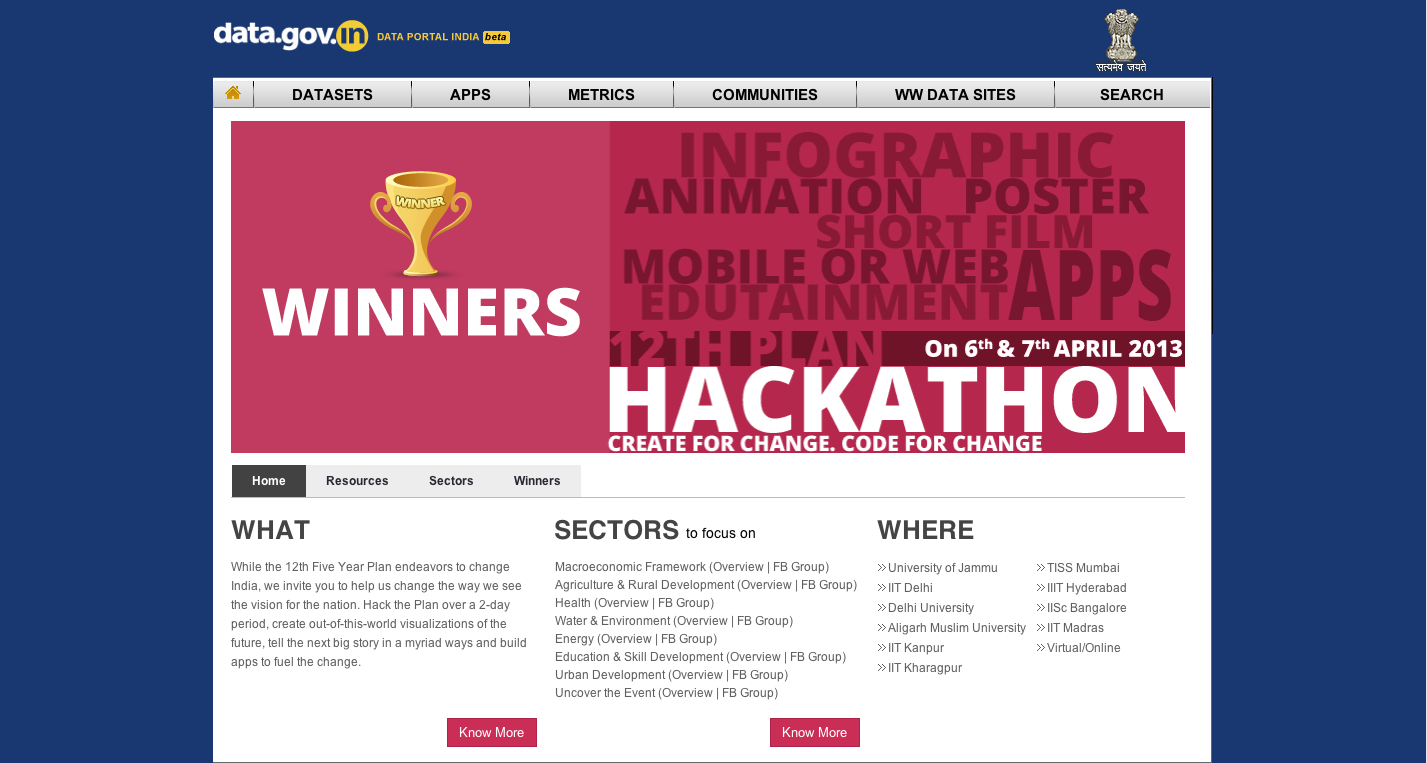
Briefly there were three categories under which you could participate. There was application, short films and visualisations (they meant infographics mainly). After some thinking (no brainer really), it was pretty clear that the skills I acquire, were good enough to do a visualisation. Although I wouldn’t have minded teaming up with someone to explore some D3 or processing visualizations (which could probably border the app category).
When I registered for this event, I wanted to be a part of this movement which realizes the value of information design in our system especially when it is an initiative by the government or likewise. With a little skepticism about their knowledge of the field of information design and judgement to decide winners, I was sure winning was not the right incentive for attending the hackathon. I wanted to see how sensitized people were to the advantage of visualizations and mostly just wanted to learn and have fun (after all it was my first hackathon)
Teams do come true!
Post registration, I put out a word on social media asking people from different fields to join me in a team . I know most of the times this is a bold step (teaming up with strangers) you don’t want to encourage because it might hamper your way of working, but with all the infographs I keep doing I might as well have given something crazy a shot. I mean what did I have to lose? I was anyways going for fun.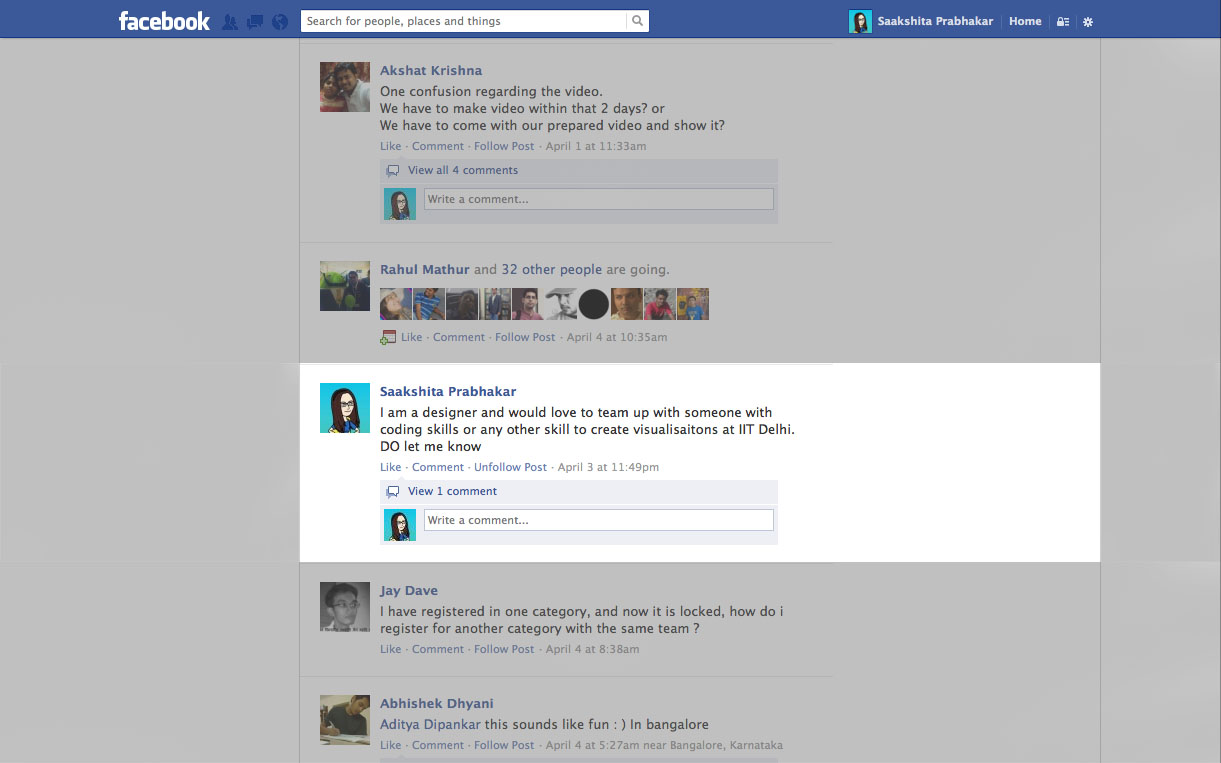
So, over the next day or two I got some response to my post on Facebook. While some didn’t work out because of technicalities, one did 🙂 Few hours before the hackathon on the 6th a person named Denzil Correa (another registered hackathon participant) wrote to me. He is a phd student in Computer Science in IIIT Delhi and dedicates a lot of time doing data mining. We exchanged some words on facebook followed by a quick competition related skype conversation at night. We weren’t really sure if teaming up on spot would be allowed but it all worked out eventually. THANK GOD!!
I got to meet him next day morning at our center (IIT Delhi) post the orientation. It’s amazing how much smoother things turn out to be if you are just open to new experiences. We got to talking about teaming up, internet, hackathon lectures, the campus and soon enough we were quite comfortable with each other. The team chemistry was great and the fact that we were strangers from different fields, it was like my dream come true team. He had done all this homework on the data he wanted to play with and I was open to almost any story in the 12th Five Year Plan so we were off to a good start. It was a great team and I couldn’t have been happier for the team work we did.
Hackathon Hours
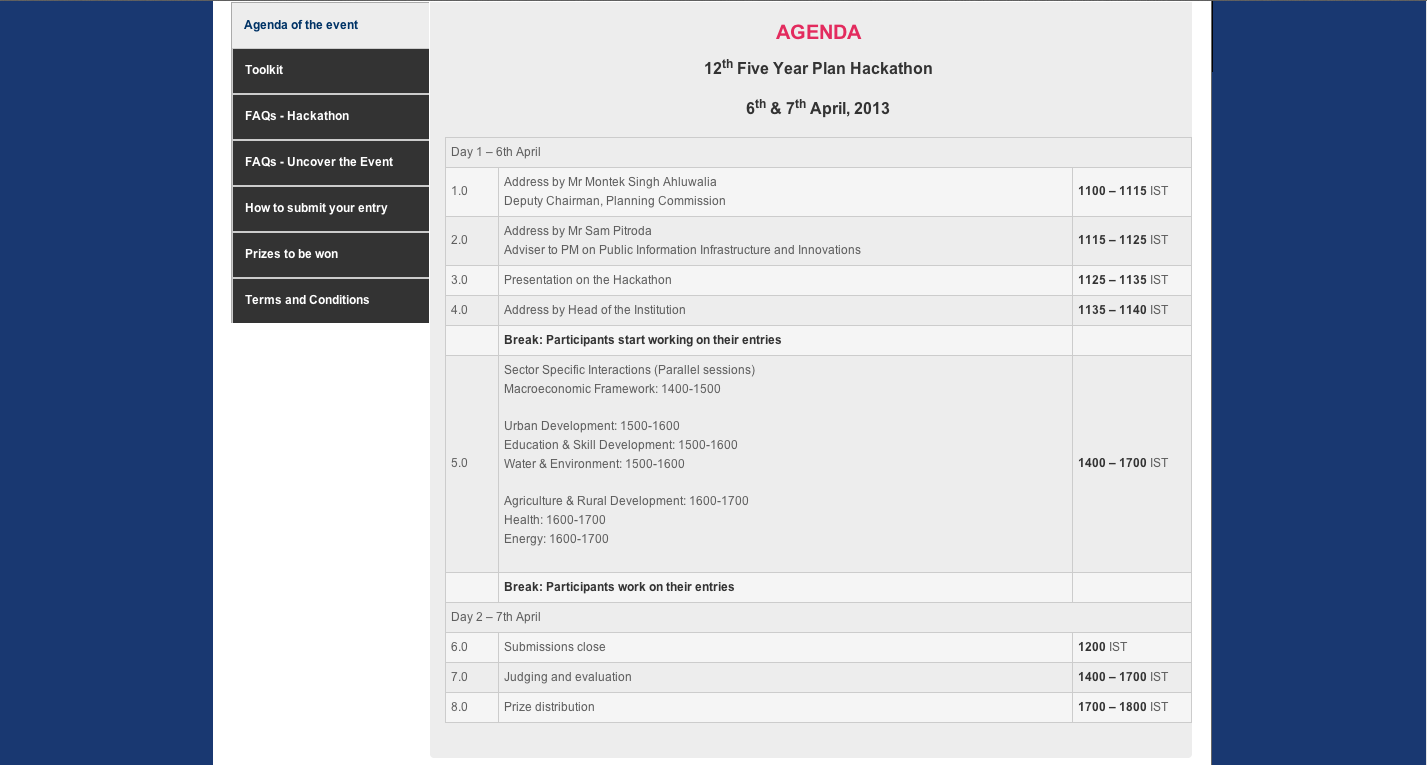
The hackathon was scheduled to be 32 hours. You can check out the agenda below:
What was reassuring was the use of google hangout to bring together the orientation for this hackathon across 10 centers. Maybe I underestimate(d) the tech savy organisation skills but the fact there was an enthusiastic young team that kept this hackathon alive on social media made a lot of sense. For most of the part, the google hangout went well albeit not so good internet condition at my centre. People could have a Q&A session on a national platform. Nothing new in the medium of using hangout, but I have to admit to see it happening for a competition in India made me proud (it’s better late than never).
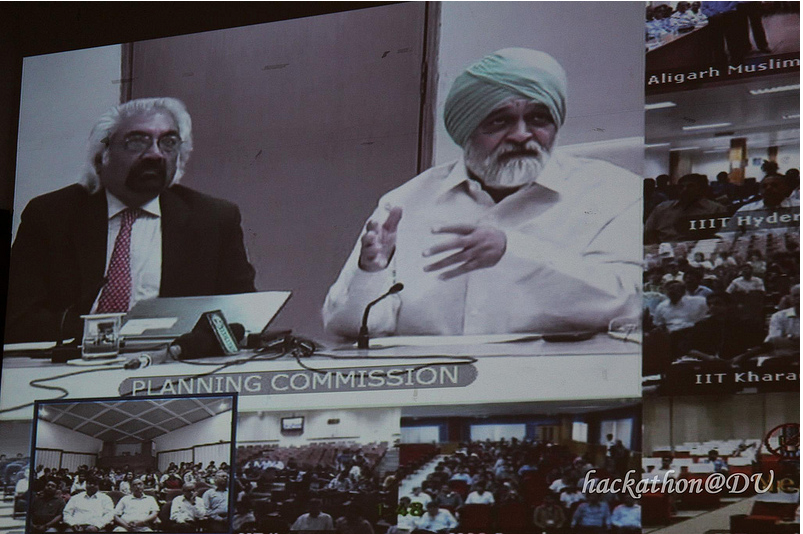
Like any other function in Indian institutes, first few hours of the hackathon had a series of important people talking, flattering and publicity stunts most of which (if not all) was not related to the hackathon. In my opinion that was a very small downside and could be ignored, sometimes you just have to do these things as formalities and it was too small an issue to get upset over or reduce my excitement about the hackathon.
The 12th Five Year Plan was divided into sectors and participants could choose any sector they wanted to work under.
This was pretty overwhelming. The reports were giving an overview and the data was all over the place (like many Indian reports). Data in these reports definately required some cleaning and sorting. At this point I had to agree with Denzil when he said ‘we should focus on one topic otherwise the data is not going to make any sense’. We decided to focus on child mortality under the health sector. Nearing the deadline it became an infographic on maternal and child care. We had strong reasons to convince ourselves why we focussed on a small aspect and maybe at that point it is not what was expected from us, but yet again we were their to do things right and not make a pseudo winning graphic. I mean its one thing to beautify an existing jumbled report and another to create something that makes an aspect more understandable and clearer. We chose the latter
Having discussed the numbers and data Denzil got together till 6 in the evening, we began to design. I made a general flow and discussed it with him. The rest is just how it always goes. Sat together till 7 in the morning and made a submission that looks like this:
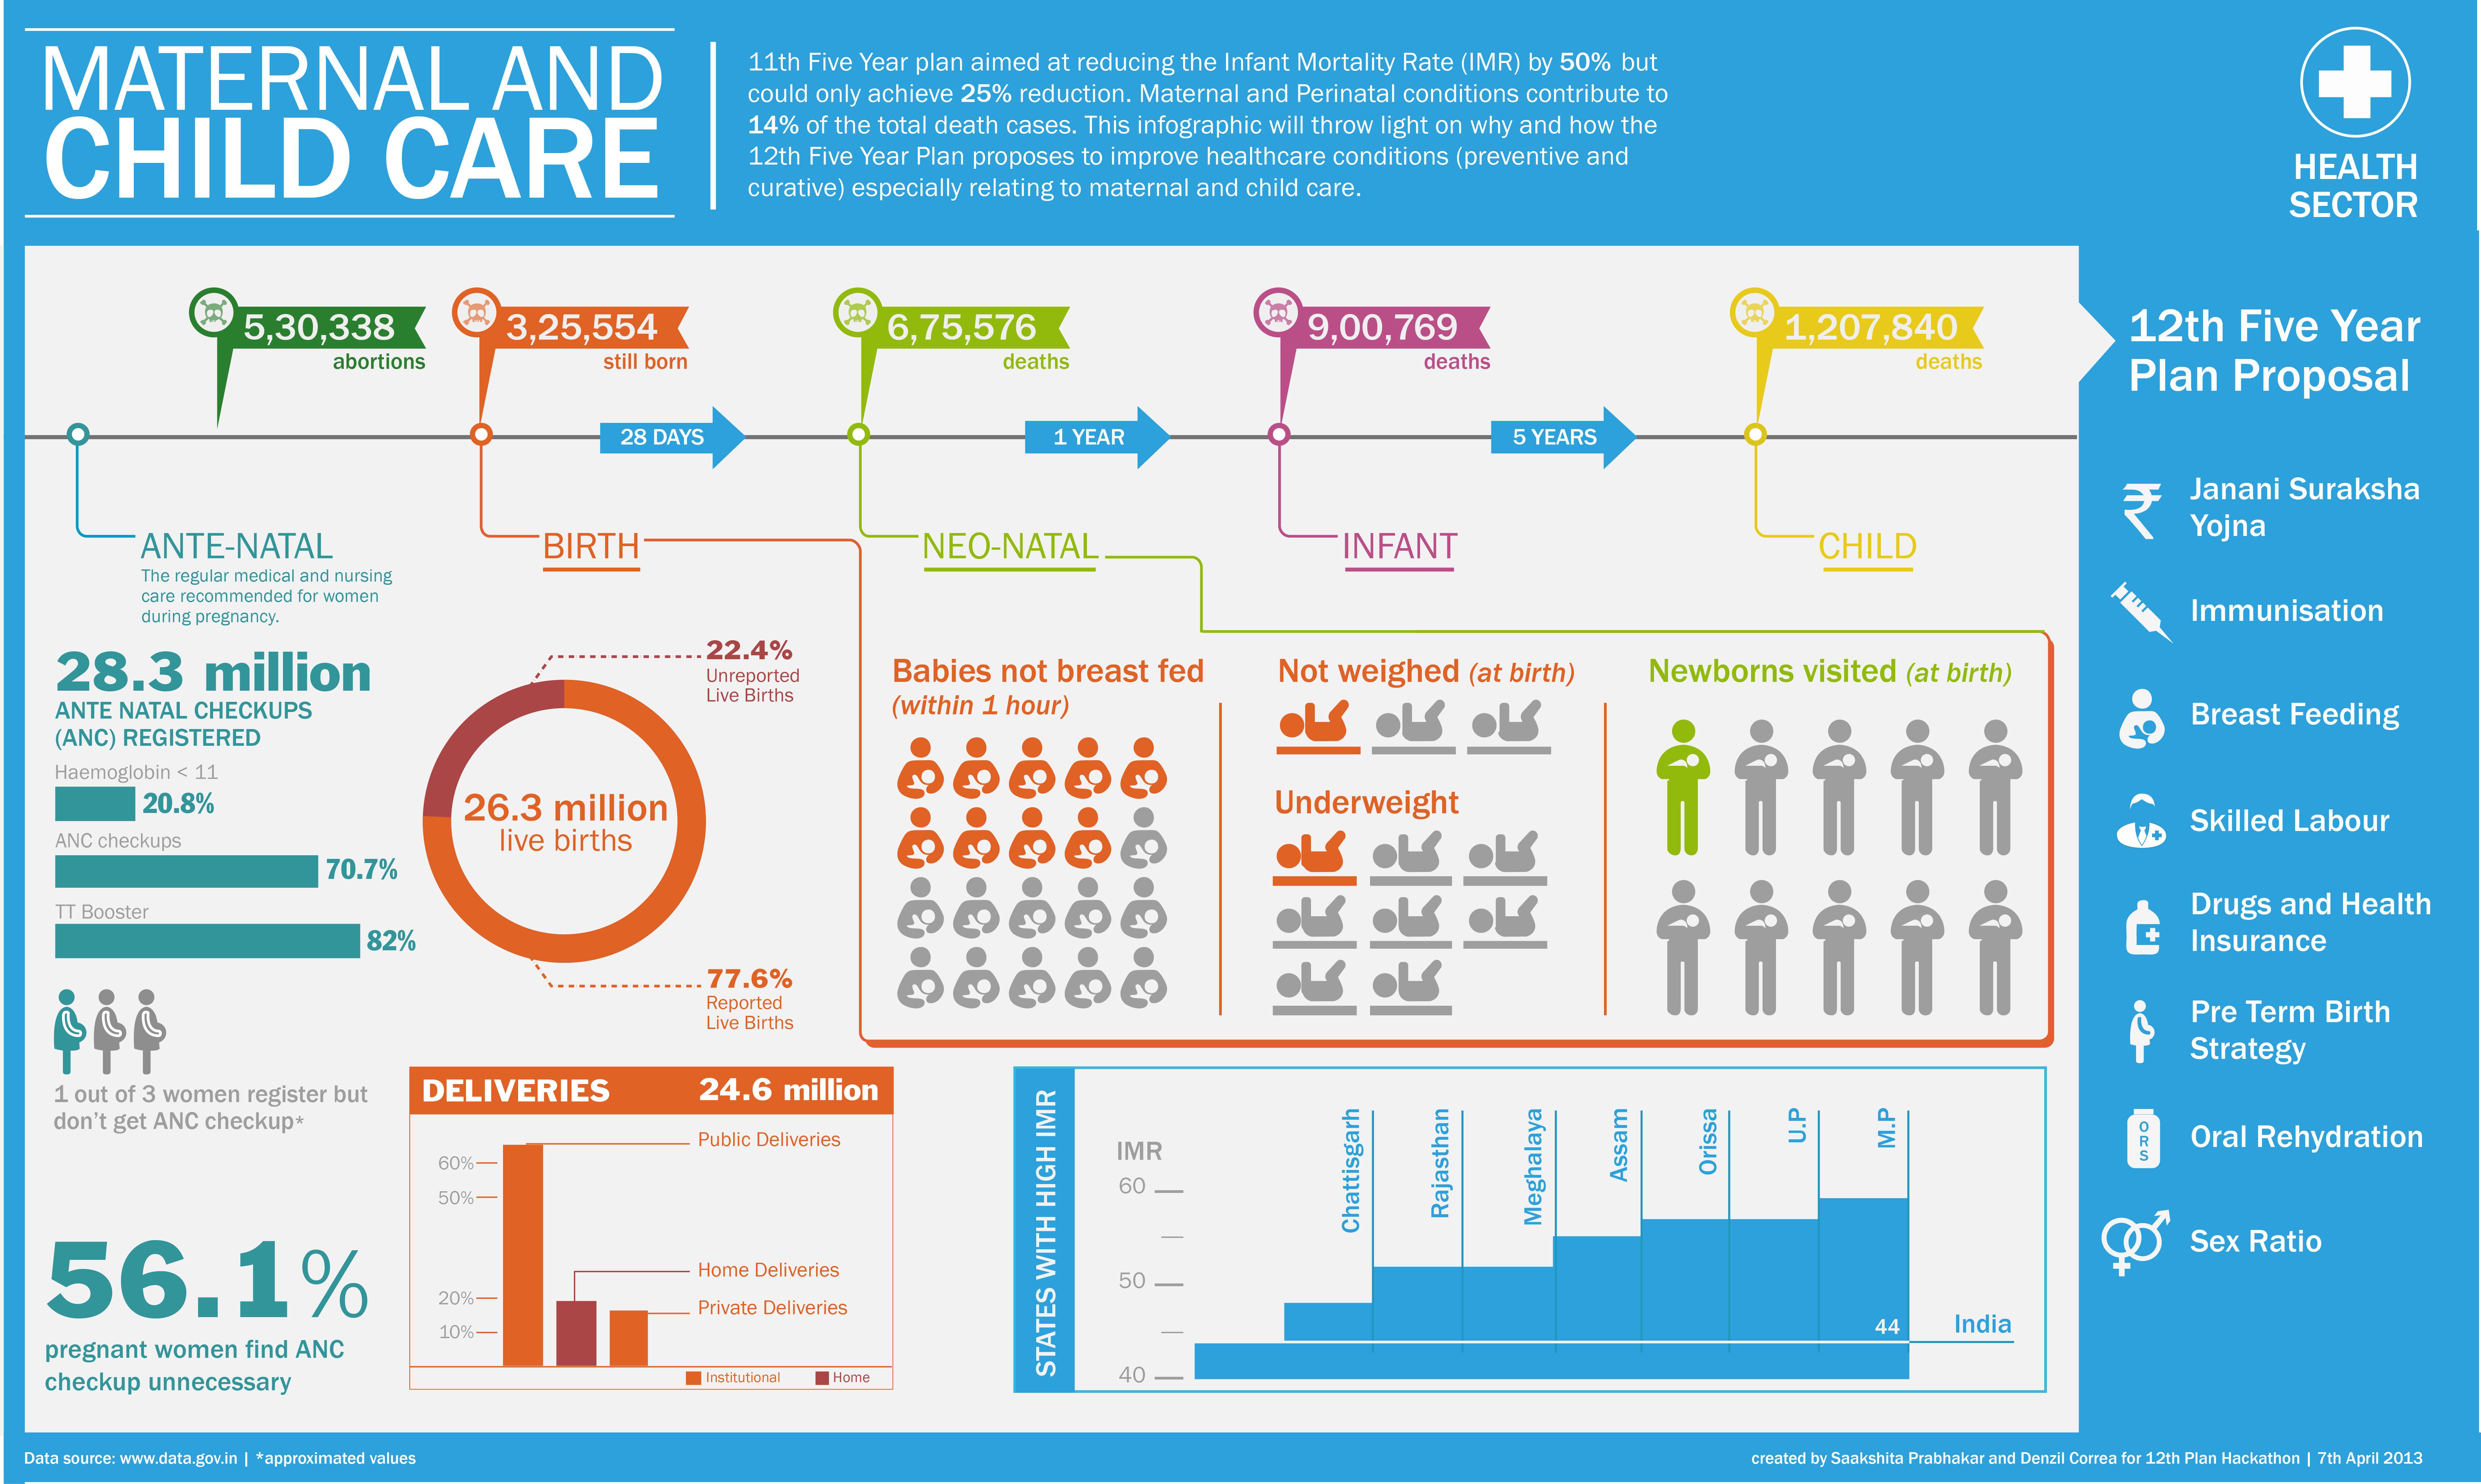
Denzil was great help as a teammate. I heard what he had in mind and tried to do justice to it in this infogrpahic. Sometimes he compromised, sometimes I; we worked like any other team members who know each other would work. After 12 hours of designing in IIT Delhi and seeing the campus sunrise, we decided to head home to get some rest and submit our entry from there (the net was a pain through most of the hackathon).
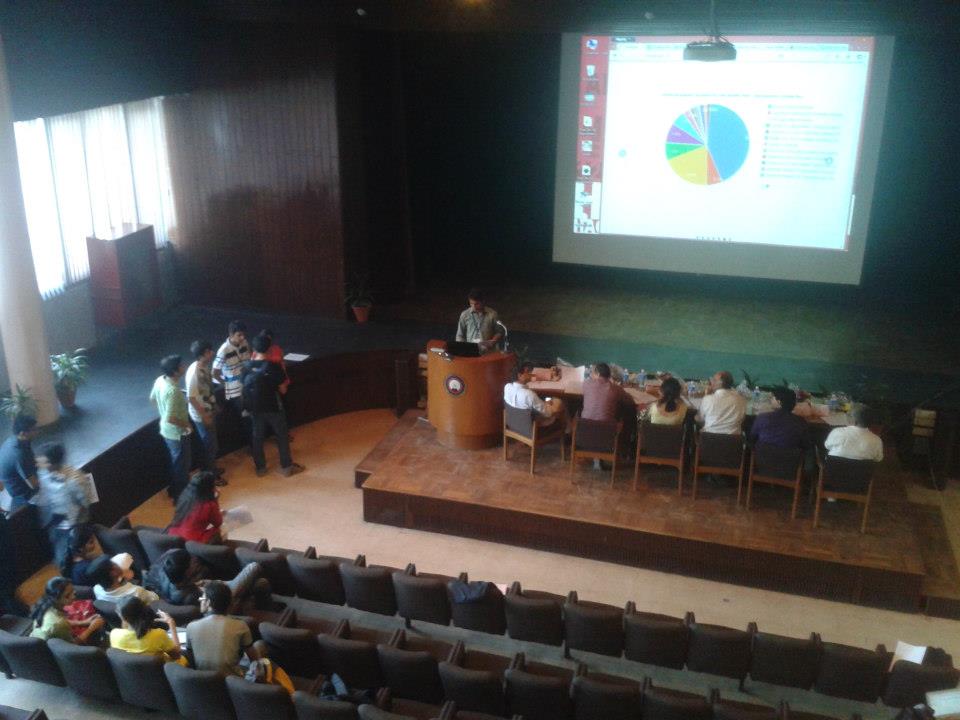
Got back to IIT Delhi at 2 pm and with everything that could possible go wrong; presentation not working, Denzil not being reachable, slow internet and god knows what not, we got through it and made that presentation to the jury 🙂 I loved it
Reaction
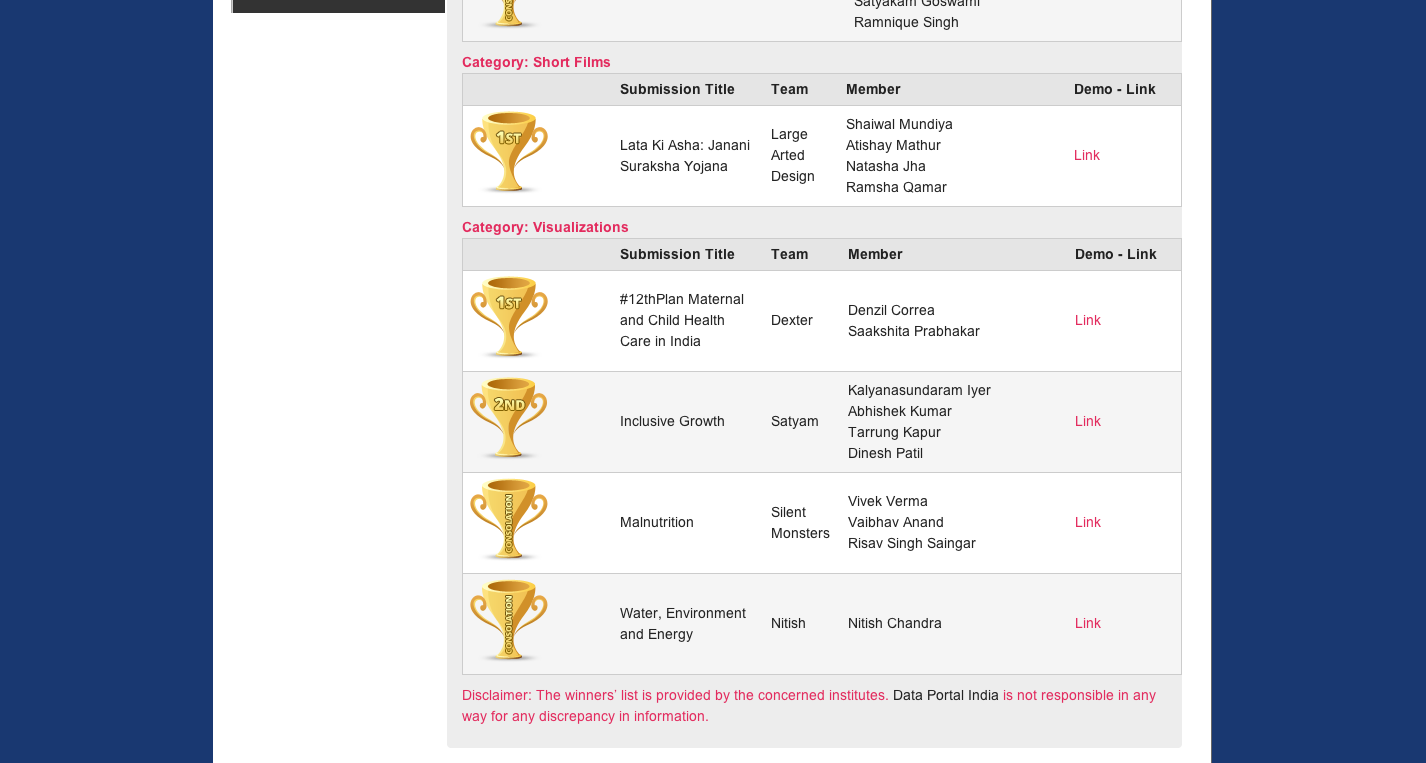
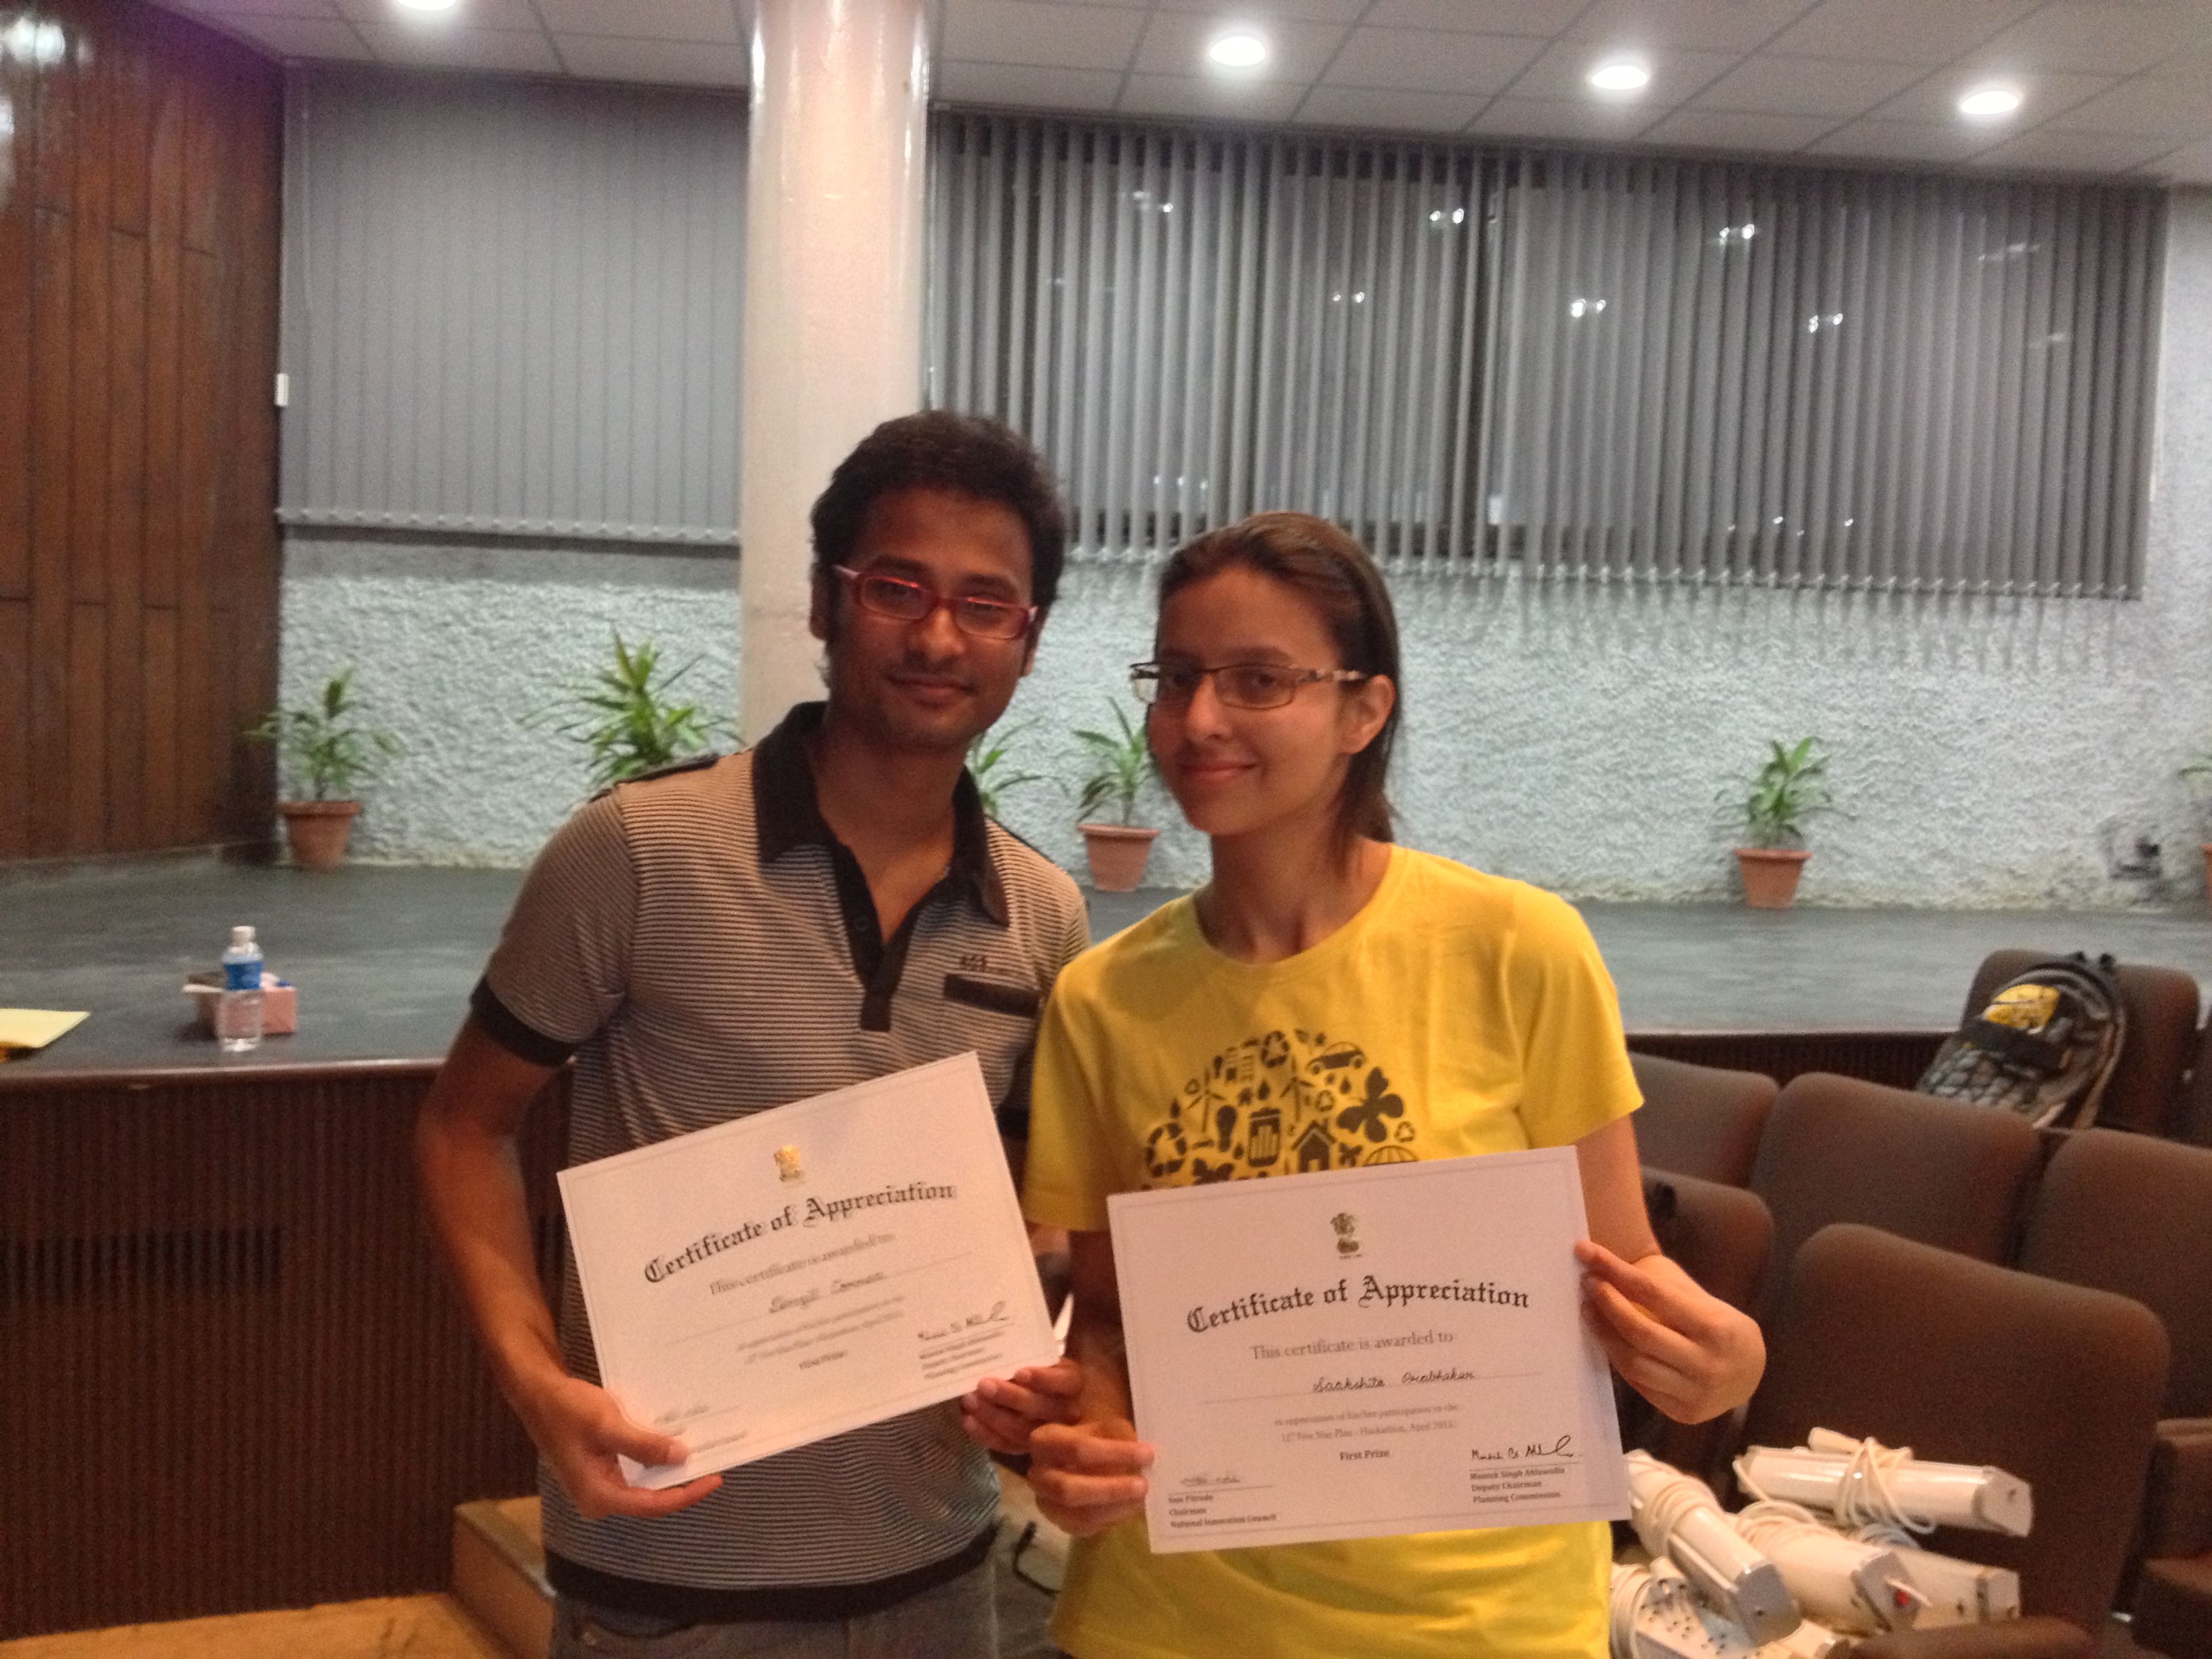
The reaction to the infographic was positive and pleasant. People appreciated the aesthetics and probably welcomed our idea of focussing on a small topic because believe it or not we were awarded the 1st prize in the visualisation category. To get an award, when it’s not your intent is a different feeling altogether (can’t pinpoint what the feeling is exactly). Post the award ceremony, we got to meet the young team behind the social presence of the hackathon and share our point of view with them. Great conversations, great people, great time, great volunteers and an awesome teammate, the hackathon was a moment to remember and definitely a positive result of taking risks. The thing I was happy about the most was the fact that I could take this opportunity to show what good info-graphics could mean and here is hoping that in few years from now we will move beyond just infographics to do great data visualizations for our country 🙂
I probably missed minute details about the hackathon but I can’t make this post any longer 🙂 so if you have anything in particular to talk or ask about, just leave a message.
Memory Lane
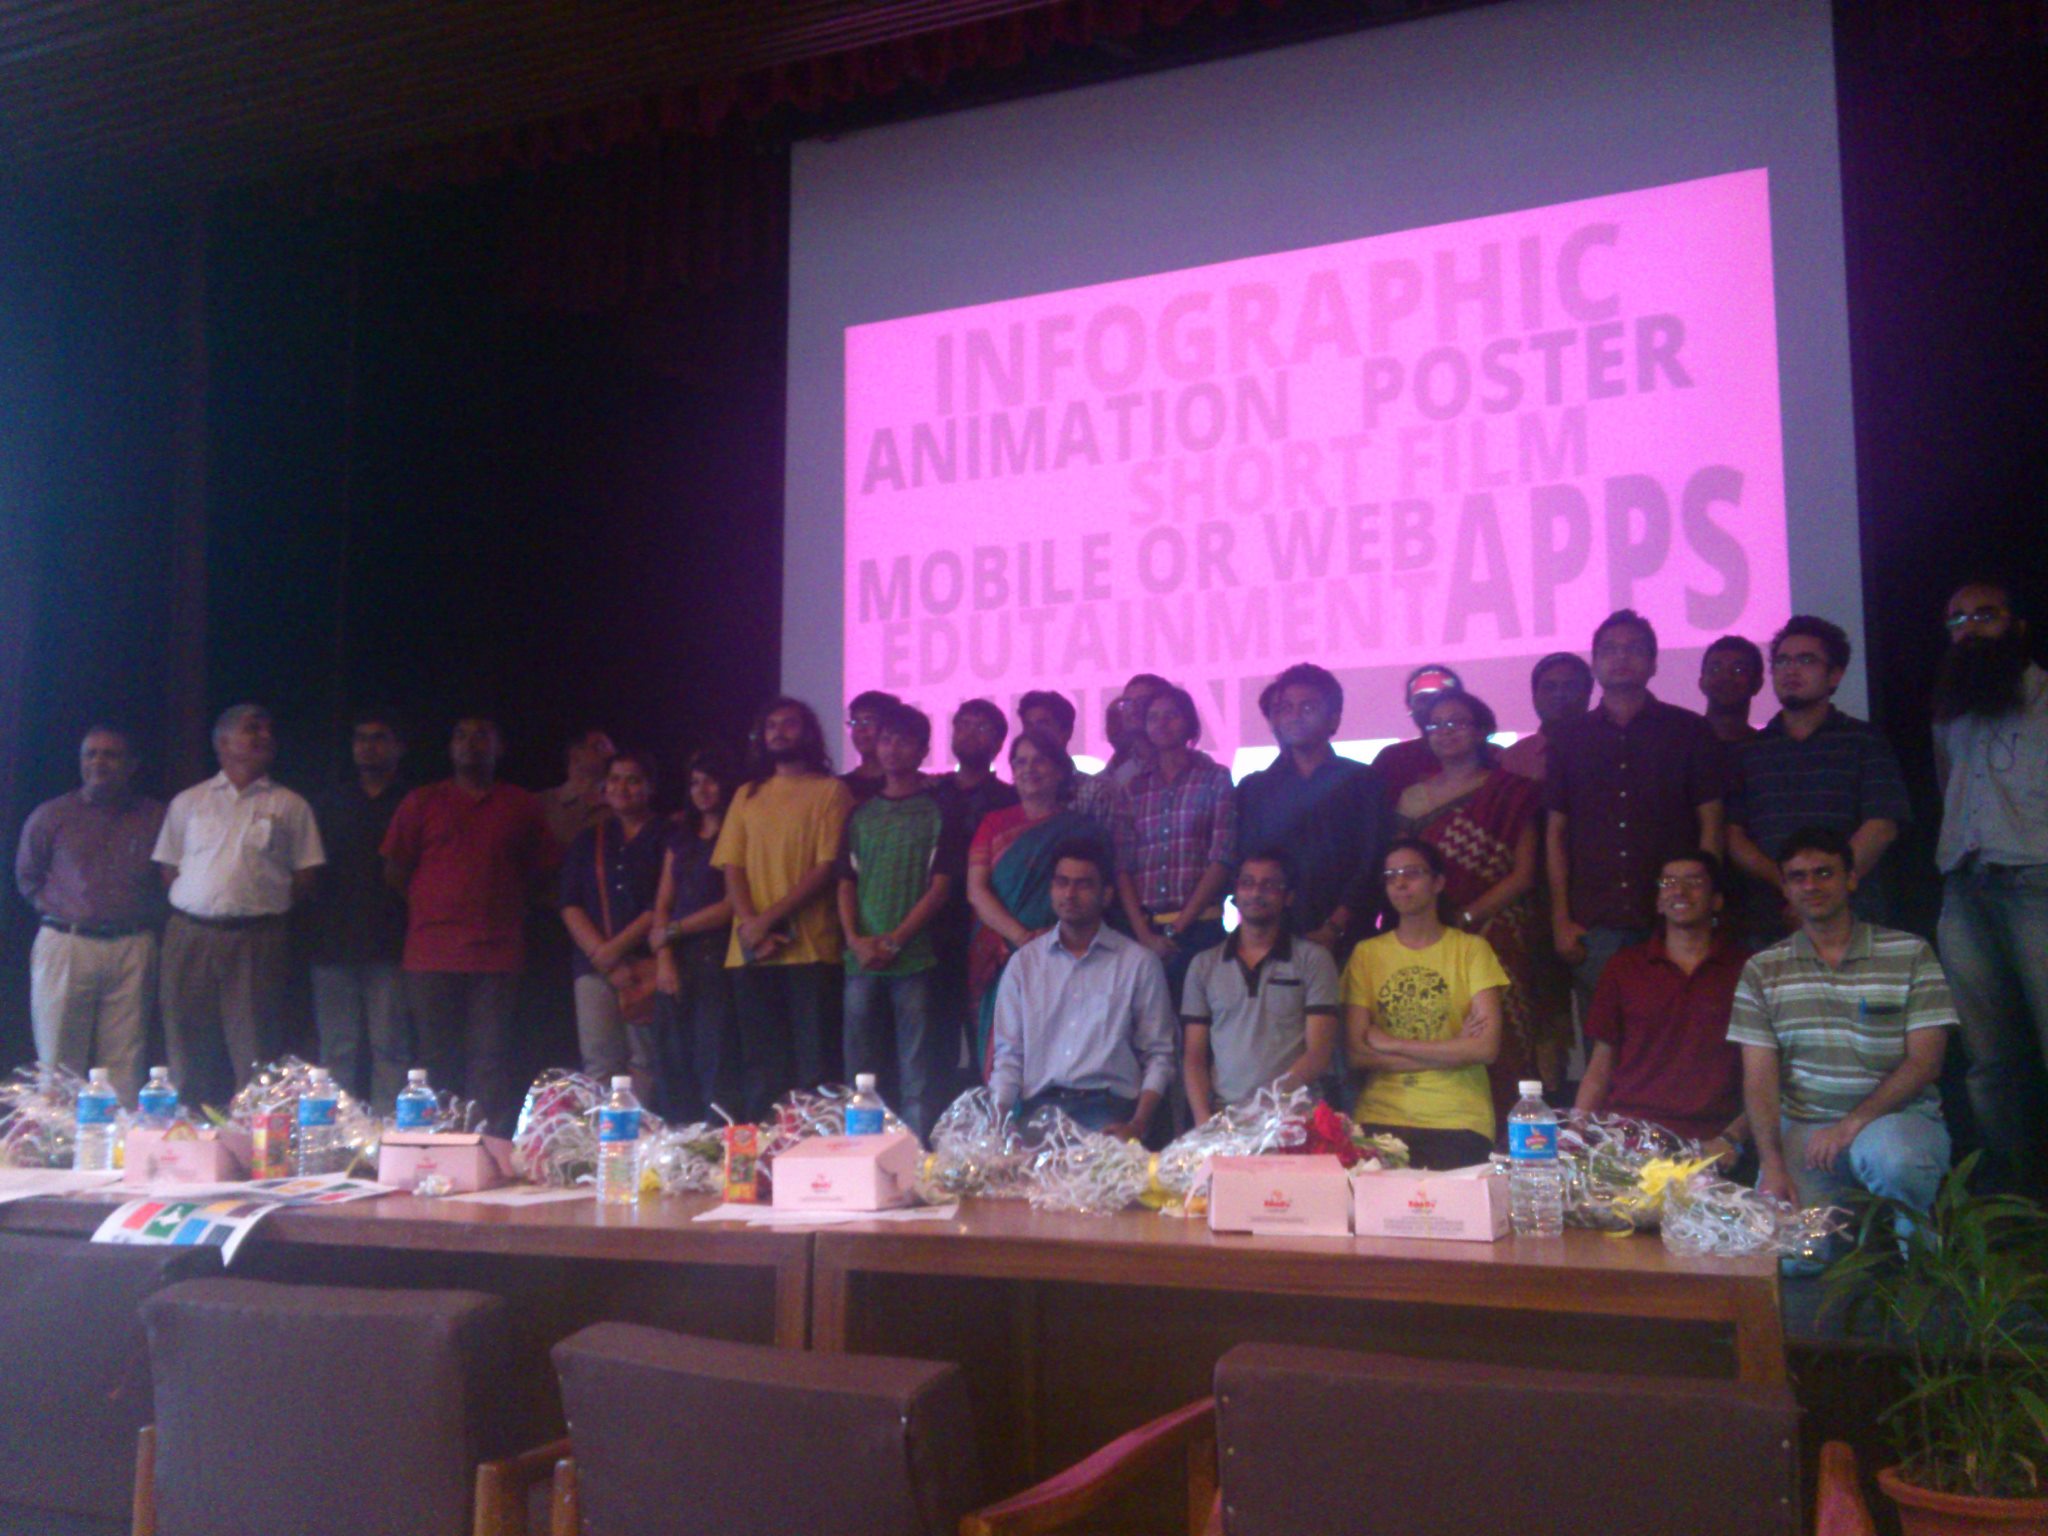
Photograph credits: Denzil Correa and Giriraj Singh Katoch
