Some examples of visualizations I see in my everyday life:
Music
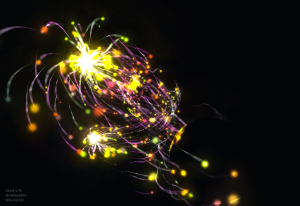
I got my MBP(shorthand for macbook pro) recently. I was listening to some of my music on iTunes, when i realized, I tunes has visualization for the music I played (slow I know). Its nothing new, but it was an accidental discovery for me and to be fair they are pretty nice 🙂 here are some snapshots of my music being visualized
reminds me of the planetary app done by bloom.io a while back, it’s pretty impressive and also won the app of the year in 2011. Check it out here
Nike+
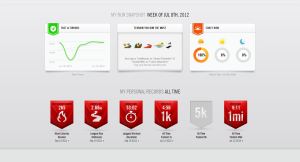
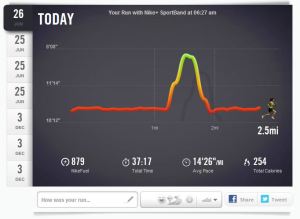
Nike+ is something I use ever more than often to map my run. I would like to take this opportunity to appreciate the Nike+ interface. It’s awesome. It documents almost everything one possibly could imagine during their run. And the fact that I run and use nike+ generates data for these visualisations. Have a look at some of them:
Cupboard
The other day my cupboard went through some hard-core anti-termite cleaning; my-o-my what a drill! Came back home to see all the mess out of its place, all coagulated together to form this annoying cluster of junk. Nothing was making sense (the number of books that existed on the bed: only 15 belonged to me) This is when I realized, this is data visualization process come to life. This is how I feel when I look at that data for the first time: overwhelming, except mostly (thankfully) I’ve encountered data at a stage post this one, where it is more organized. Anyhow, let’s go through this data viz process, shall we:
Stage 1 – Find Data
No problem there now, because the data found me:
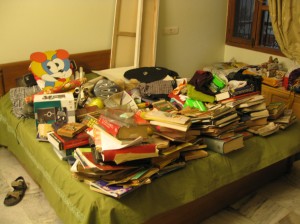
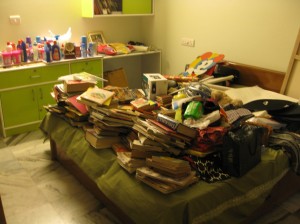
This is well, almost all the data of my cupboard mixed up and ambiguous. So, with that I can safely say this is a process to rearrange or design my cupboard.
Stage 2 – organize data
This is after I sift or glance through all that data and make a decision of the possible categories and slots hidden in this data. Attempt at categorizing and organizing can be seen here
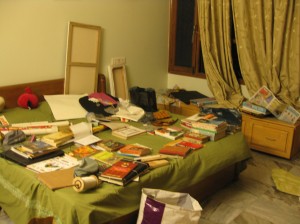
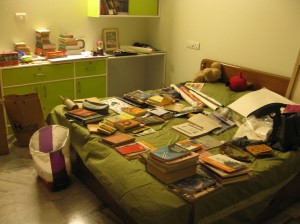
A conscious decision-making starts happening here, you start spotting redundant information, finding patterns and compartmentalize all your info in your head
Stage 3 – Designing
Well to be honest, there might be a couple of stages in the middle, but I couldn’t document all of them with my room: I got tired and slept in stage 2 :O. After distinguishing the data and categorizing it, essentially I start by making the skeleton for the layout. In this case the skeleton was given to me in the form of my cupboard design (shelves, drawers, lofts etc). So, all I needed to do was put the contents in the skeleton, in other words design the piece and well this finished piece at the end of it, looked something like this:
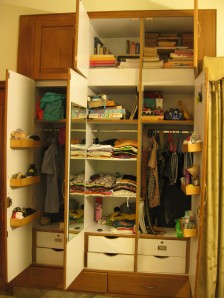
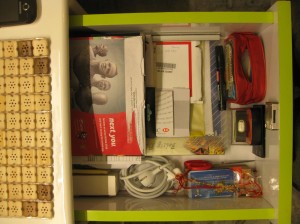

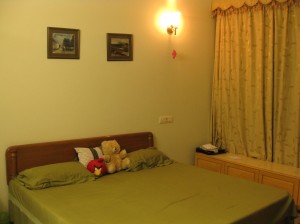
Pardon the jarring lights but besides that a pretty clean, minimalistic and organized design. I know the cupboard is not the most photogenic, but who am I kidding its a cupboard and this is probably the best I can do with it. All contents are organized and located in the design and working in harmony with the rest of the room. It has balance, contrast, harmony, symmetry and all the other design principles.
Stage X – Redundant information
There is a very important thing to keep in mind while designing: and that is to remove all the redundant information. This here is basically all the redundancy in my cupboard separated from the rest to be used in a more effective manner elsewhere:
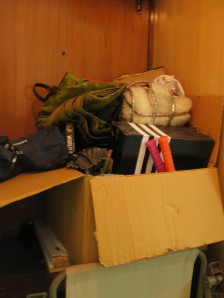
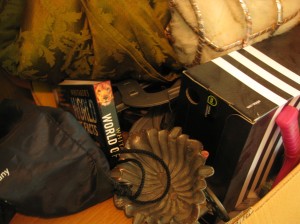
SPECIAL thanks to my sister who I share my room and the data with.

